Chart Tag
Google Charts and Chart.js are popular HTML5 charting libraries for the web. We’ve created several templates to simplify their use and included them in Efw as a tag. It must be used after the Client tag, which includes jQuery and jQuery UI.
<%@ taglib prefix="efw" uri="efw" %>
<head>
<efw:Client/>
<script>
function func1(options) {
// alert(JSON.stringify(options)); // to show the options as string.
options.options.vAxis.ticks = [100, 1000000]; // this will override the data-ticks attribute
}
</script>
</head>
<body>
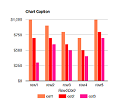
<efw:Chart id="char1" data="chart1_data" type="column" width="400" height="250" version="45.2" setoptions="func1" /> // or efw:chart, efw:CHART
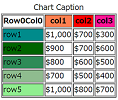
<table border="1" id="chart1_data" data-format="#,##0百万円" data-legend="bottom" data-ticks="100,1000000">
<caption>会社業績</caption>
<tr><th>年度</th><th data-color="red">売上高</th><th data-color="green">営業利益</th><th data-color="blue">経常利益</th></tr>
<tr><td>2004 年</td><td>1,000百万円</td><td>400百万円</td><td>380百万円</td></tr>
...
</table>
</body>
Attributes
| Name |
Required |
Default |
Description |
id |
Yes |
|
The ID of the Chart tag. |
mode |
No |
"googlechart" |
Sets the charting library to "googlechart" or "chartjs". |
data |
Yes |
|
The ID of the data table to use with the Chart tag. |
type |
Yes |
|
The type of chart. Demo. |
height |
No |
"400" |
The height of the Chart tag in pixels. |
width |
No |
"auto" |
The width of the Chart tag in pixels. |
version |
No |
"current" |
The version of Google Charts to use. |
setoptions |
No |
|
The name of a custom JavaScript function to set options for Google Charts. |
data-format |
No |
|
The format of the data. If defined, the tooltip data will be formatted. |
data-legend |
No |
|
The position of the legend: none, left, right, top, or bottom. |
data-color |
No |
|
The color of items. Set with RGB or color names in row or column titles. Demo.
   |
data-ticks |
No |
|
The gradations of the chart. |
Methods
| Calling |
Returning |
Description |
chart. draw ( ) |
void |
Redraws the chart. |
chart. setType ( type ) |
void |
Sets the type attribute. |
chart. setHeight ( height ) |
void |
Sets the height attribute. |
chart. setWidth ( width ) |
void |
Sets the width attribute. |
Type for Google Chart
| |
|
|
|
|
| column |
stackedcolumn |
line |
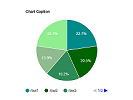
pie |
donut |
 |
 |
 |
 |
 |
| bar |
stackedarea |
area |
scatter |
|
 |
 |
 |
 |
|
Type for Chart Js
| |
|
|
|
|
| column |
stackedcolumn |
line |
pie |
donut |
 |
 |
 |
 |
 |
| bar |
stackedarea |
area |
scatter |
radar |
 |
 |
 |
|
 |