efw4.X
Chart 标签
Google Charts 和 Chart.js 是流行的 HTML5 图表库,用于 Web 开发。 我们创建了一些模板来简化它们的使用,并以标签的形式包含在 Efw 中。 它必须在包含 jQuery 和 jQuery UI 的 Client 标签之后使用。
<%@ taglib prefix="efw" uri="efw" %>
<head>
  <efw:Client/>
  <script>
    function func1(options) {
      // alert(JSON.stringify(options)); // 以字符串形式显示选项。
      options.options.vAxis.ticks = [100, 1000000]; // 这将覆盖 data-ticks 属性
    }
  </script>
</head>
<body>
  <efw:Chart id="char1" data="chart1_data" type="column" width="400" height="250" version="45.2" setoptions="func1" /> // 或 efw:chart, efw:CHART

  <table border="1" id="chart1_data" data-format="#,##0百万円" data-legend="bottom" data-ticks="100,1000000">
    <caption>会社業績</caption>
    <tr><th>年度</th><th data-color="red">売上高</th><th data-color="green">営業利益</th><th data-color="blue">経常利益</th></tr>
    <tr><td>2004 年</td><td>1,000百万円</td><td>400百万円</td><td>380百万円</td></tr>
    ...
  </table>
</body>
属性
| 名称 | 是否必需 | 默认值 | 描述 |
|---|---|---|---|
id |
是 | Chart 标签的 ID。 |
|
mode |
否 | "googlechart" |
设置图表库为 "googlechart" 或 "chartjs"。 |
data |
是 | 要与 Chart 标签一起使用的数据表的 ID。 |
|
type |
是 | 图表的类型。 演示。 | |
height |
否 | "400" |
Chart 标签的高度,单位为像素。 |
width |
否 | "auto" |
Chart 标签的宽度,单位为像素。 |
version |
否 | "current" |
要使用的 Google Charts 版本。 |
setoptions |
否 | 用于为 Google Charts 设置选项的自定义 JavaScript 函数的名称。 | |
data-format |
否 | 数据的格式。如果定义,则工具提示数据将格式化。 | |
data-legend |
否 | 图例的位置:none、left、right、top 或 bottom。 |
|
data-color |
否 | 项目的颜色。使用 RGB 或行或列标题中的颜色名称设置。演示。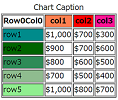 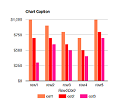 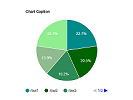 |
|
data-ticks |
否 | 图表的刻度。 |
方法
| 调用 | 返回值 | 描述 |
|---|---|---|
chart.draw() |
void |
重绘图表。 |
chart.setType(type) |
void |
设置 type 属性。 |
chart.setHeight(height) |
void |
设置 height 属性。 |
chart.setWidth(width) |
void |
设置 width 属性。 |
面向Google Chart的图标类型
| column | stackedcolumn | line | pie | donut |
 |
 |
 |
 |
 |
| bar | stackedarea | area | scatter | |
 |
 |
 |
 |
面向Chart Js的图标类型
| column | stackedcolumn | line | pie | donut |
 |
 |
 |
 |
 |
| bar | stackedarea | area | scatter | radar |
 |
 |
 |
|
 |